Content below is courtesy of the U.S Chamber of Commerce
What is the success rate of small businesses?
Many people think that small businesses have it quite easy due to the wealth of entrepreneurship in the United States. The reality, however, is that 18% of small businesses fail within their first year, while 50% fail after five years and approximately 65% by their tenth year in business. This information is as per the Bureau of Labour Statistics.
One of the factors in the success rate of small businesses is definitely the geographic location. As of 2019, Michigan, Washington, and Kansas are the three states with the highest business failure rates, according to information found on Zippia. Massachusetts, Louisiana, and California, on the other hand, have the highest success rates.
The small business’s “industry” is another major factor in its success rate. The healthcare industry has the highest success rate, which is unsurprising, with 60% of small businesses staying afloat beyond their first year. Construction, transportation, and warehousing have the worst rates of success at 30% and 40%, respectively, following the fifth year.
According to a survey conducted by CB Insights, one of the major reasons for businesses failing is due to their inability to secure finances as well as running out of money. Additionally, some small businesses go out of business due to their products getting out-competed or becoming obsolete.
How many small businesses are started each year?
In a 2021 new business insights report conducted by Intuit, it’s estimated that 17 million new small businesses will be formed by the end of 2022. This comes as the pandemic brought on by the coronavirus has had dramatic effects on how people choose to work and has played a huge role in many people working at big businesses to launching their own businesses or becoming their own bosses. Different states, however, see drastically different numbers. Take the case of three different US States. In March 2024, according to the US Census, business filings in South Carolina dropped 8.7%, North Carolina business applications went down only 1%, and Michigan new business formations dropped 6.3%.
What number of employees must a business have in order to be defined as a small business?
Many people determine a small business based on the amount of money it generates as well as the number of employees it has rather than each of its business locations. According to the US Small Business Administration’s definition of a small business, small businesses are defined by firm revenue (which ranges from $1 million to over $40 million).
Additionally, it is determined by the number of employees ranging from 100 to over 500 employees. For example, a roofing contractor earning an annual revenue of $16.5 million or less is considered a small business.
How many small businesses are there in the United States?
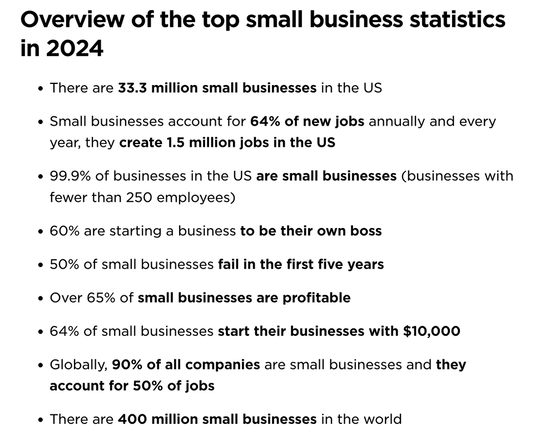
The number of small businesses in the United States as of 2022 is 32.5 million. This comprises 99.9% of all American businesses, according to the SBA. Many of the big-name chains you see qualify as small businesses if they operate locally. Of the 4,500 current business owners found during a survey conducted by Guidant Financial, 41 of them owned franchise businesses.
How many small businesses in the United States are individually operated? The number of small businesses owned and operated individually in the United States is 70%.
What percentage of businesses in the United States are small businesses? A whopping 99.9% of businesses in the United States are small businesses, owing to the rather large threshold of 500 employees or fewer.
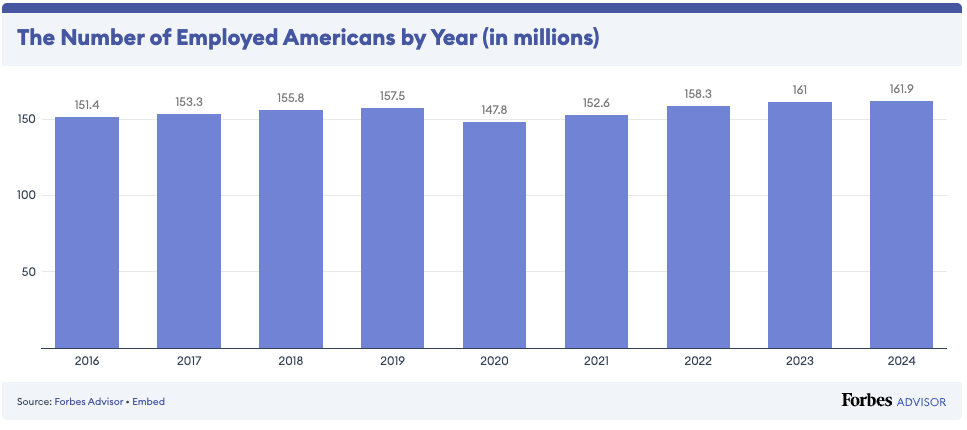
What percentage of people work for small businesses? The number of small business employees has increased naturally over the last few years as more and more small businesses in the US are established. The number of employees and small businesses in the US in 2022 sits at 61.7 million. Therefore, approximately 46.4% of people work for small businesses.
What percentage of new jobs come from small businesses? The small business industry makes up 99.9% of all businesses in America. Therefore, it should be no surprise that small businesses create many job opportunities. According to the SBA, 1.5 million jobs are created by small companies each year and account for 64% of new jobs in the US.
According to SBA statistics, it shows that an integral part of the US economy and growth has come from small businesses. Therefore, financial growth, job opportunities, as well as the many unique services and products stem from small businesses in the US. Ultimately, they are known to contribute to economic growth.
In which industries are startups most likely to succeed? Healthcare and social assistance is the industry where small businesses succeed the most: 85% of small businesses in this industry are still up and running after one year, 5% above the average survival rate.
In which industries are startups most likely to fail? The industry with the highest failure rate in the United States is the technology industry. Around 75% of all fintech start-ups clash within two decades, while approximately 30% of start-ups with venture backing end up failing.
The average venture capital firm receives more than 1000 proposals per year, and 22% of start-ups that fail don’t have a sound marketing strategy. 34% of small businesses that fail do so due to a lack of proper product-market fit, and payroll is one of the highest costs any business incurs. However, the failure rate for new start-ups across all industries is currently 90%, while 10% of new businesses don’t survive the first year.
How many small businesses are profitable? Approximately 65.3% of small businesses operating in the United States in 2022 are thriving and making money.
What percentage of U.S. businesses are run from home? According to the SBA or US Small Business Administration, 50% of all businesses start at home. The SBA also reports that 60% of all businesses without staff are home-based. This means that of the 32.5 million small businesses currently operating in the US, 19 million of them are home-based.
What is the median income for self-employed entrepreneurs? The average income for self-employed owners of small businesses is $51,816 per year, according to the SBA. When it comes to unincorporated businesses, the average income is $26,084. However, the data may be somewhat skewed due to the fact that lots of entrepreneurs use their entrepreneurial skills in side gigs and are not fully self-employed. However, though many entrepreneurs do see huge financial success, most of them will not see millionaire or billionaire status.
Find more information on How to start a business here.
Demographics
Women and minorities in business statisticsWhat percentage of small businesses in the U.S. are women-owned? Taking a look at the demographics, women own 13 million small businesses in the United States. Overall, this is 42% of small businesses in the United States. Together, these businesses employ 9.4 million people.
According to the U.S. Census Bureau’s annual business survey, men currently own more small businesses than women. In fact, the survey found that one in every five employer firms in the US is women-owned. However, the number of female businesses grew 0.6% year over year. Women-owned businesses grew by 21% over the past five years. Consequently, women-owned business employees rose by 8% over the last five years.
What are the fastest-growing states for women-owned businesses? Women-owned businesses tend to be successful across the country. However, geographic trends of all 50 states as well as the District of Columbia were analyzed, and the states with the largest growth in the number of women-owned firms in 2019 are as follows:
- Michigan
- Florida
- Georgia
- Nevada
- South Carolina
What percentage of U.S. businesses are minority-owned?
According to a recent annual business survey, approximately 18.7% or 1.1 million of US employer businesses were minority-owned.
Additionally, it was estimated that Asian-owned businesses, with around 23.8% in the accommodation and food services sector, accounted for 581,200 small businesses. The largest estimated receipts can be credited to Asian-owned businesses and amounted to $874.6 billion among minority race groups across all sectors. Additionally, 26,064 Alaska Native and American Indian-owned businesses are estimated to have $35.8 billion in receipts, with $8.7 billion in annual payroll for 215,049 employees. African-American or Black-owned businesses accounted for 134,567 businesses with $133,7 billion in annual receipts. Approximately 1.3 million employees and about $40.5 billion in yearly payroll. Additionally, 39,705, or 29.5% of these small businesses, were in the social assistance and healthcare sector. The number of Hispanic-owned businesses also saw a rise of about 4.6% from 2018 to 2019. Hispanic-owned businesses accounted for 6% or 346,836 of all businesses, with an estimated $463.3 billion in annual receipts.
How many veteran-owned businesses are in the U.S.? Veteran-owned businesses account for 5.7% or 331,151 of all small businesses. Additionally, veteran-owned businesses had an estimated 963.4 billion in receipts. This makes up 191.6 billion in annual payroll for 4.0 million employees.
Statistics Business Center
Forbes Advisor Small Business Statistics of 2024
|
Small Business Employment Statistics
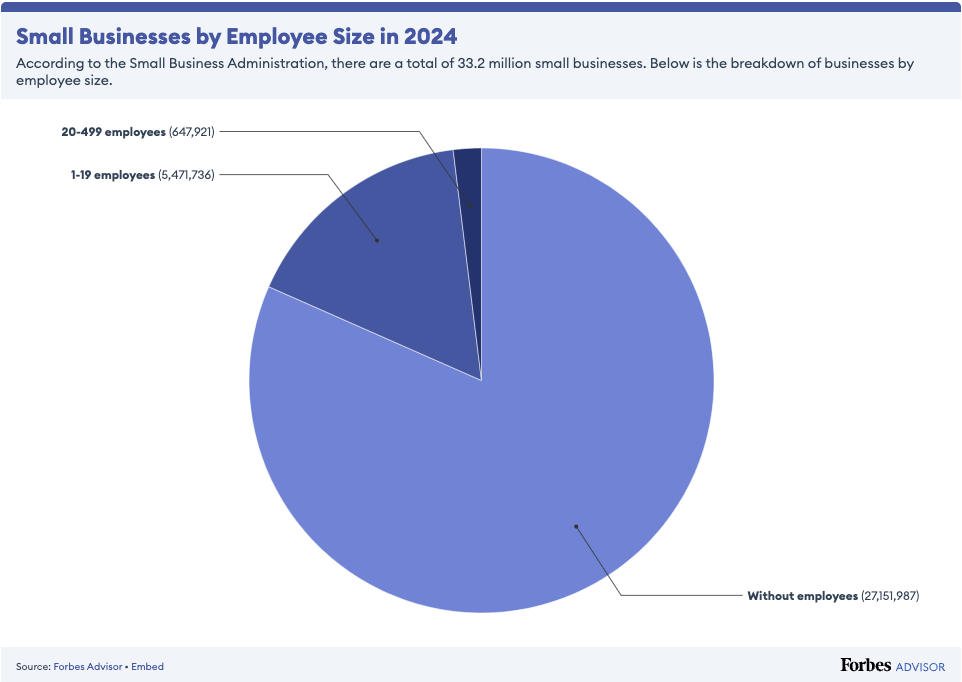
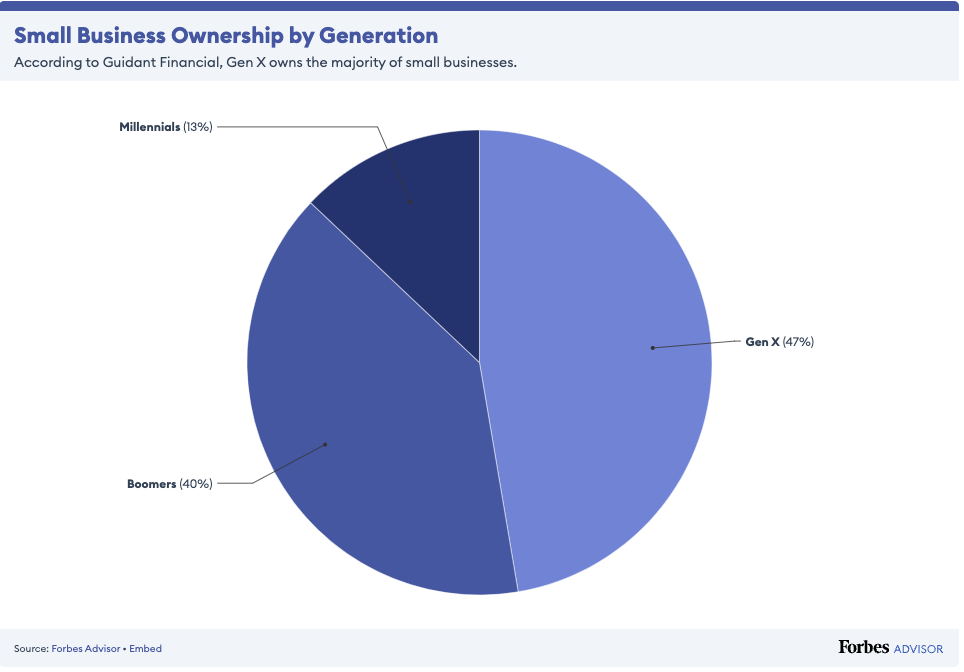
1. Almost all businesses across the U.S. are small businesses 2. Nearly half of all U.S. employees are employed by a small business 3. Over eight out of 10 small businesses have no employees 4. Just 16% of small businesses have one to 19 employees Small Business Job Creation 5. Small businesses have added over 12.9 million jobs in the last 25 years 6. The leisure and hospitality industry has the highest average of jobs added per month over the last year 7. The industry with the most job openings is the professional and business services industry 8. The industry with the highest projected job growth is home health and personal care 9. The leisure and hospitality industry is still recovering from Covid-19 10. Nevada and D.C. have the highest unemployment rates in the nation 11. New Jersey had the largest increase in unemployment over the last year 12. The number of U.S. jobs will increase by 87,000 in 2024 13. By 2032, the number of U.S. jobs is projected to increase by 4.7 million 14. The fastest-growing industries are healthcare and social assistance 15. The industry that will add the most jobs is individual and family services Small Business Salaries and Wages 16. The average salary of a small business owner is just 16% above the annual mean wage in the U.S. 17. Hourly earnings have increased more than 4% over the last year Small Business Ownership Statistics 18. Millennials own just 13% of small businesses in the U.S. 19. More small businesses are owned by males than females 20. Nearly one out of three businesses still don’t have a website 21. Over 25% of business is conducted online 22. Over three-quarters of shoppers visit a business's website before its physical location 23. Labor remains the number one cost for business 24. Inventory is the second biggest cost for small businesses 25. Marketing accounts for just 9% of a business revenue on average 26. Small Business Spending Adjustments in Response to 3% Inflation Rise Small Business Survival Statistics 27. Over 180,000 more small businesses opened than closed last year 28. One in five businesses fail within the first year 29. Businesses are most likely to fail from funning out of capital 30. Lack of market need is the second most common reason small businesses fail 31. The construction industry has the highest failure rate 32. The industries with the highest survival rate are healthcare and social assistance Conclusion: What do these statistics mean for small businesses? Small businesses can glean a lot of insight by looking at business statistics. Not only does data help provide intel on the general business climate—the one in which all businesses operate within, but statistics can also be leveraged to enable businesses to better plan for the future based on the direction in which the data is pointing to. Of course, while every business will potentially interpret and apply the data differently, this is exactly what can help give one small business a leg up on those that do not. Methodology To compile our list of the top small business statistics of 2024, we went directly to the information powerhouses, such as the Bureau of Labor Statistics and the United States Small Business Administration (SBA) to acquire and analyze available data. We considered the source quality, relevance and timeliness of the data to present, compare, contrast and overlay data to create more useful insights for small businesses. |
All big businesses once started out small. Not only are small businesses driving the U.S. economy, but they also keep the American dream alive. The opportunity for people to found, run or work for small businesses is the pathway to achieving the American dream.
|
|
About Us: Our Story_Contact Us
Ohana Specials Technology Park Office Landing Cannabis Island Living & Style Something for You Food Court Healthy You (Coming Soon) Travel (Coming Soon) |
©2024 ohanacity.com

